 Score Trends Chart" />
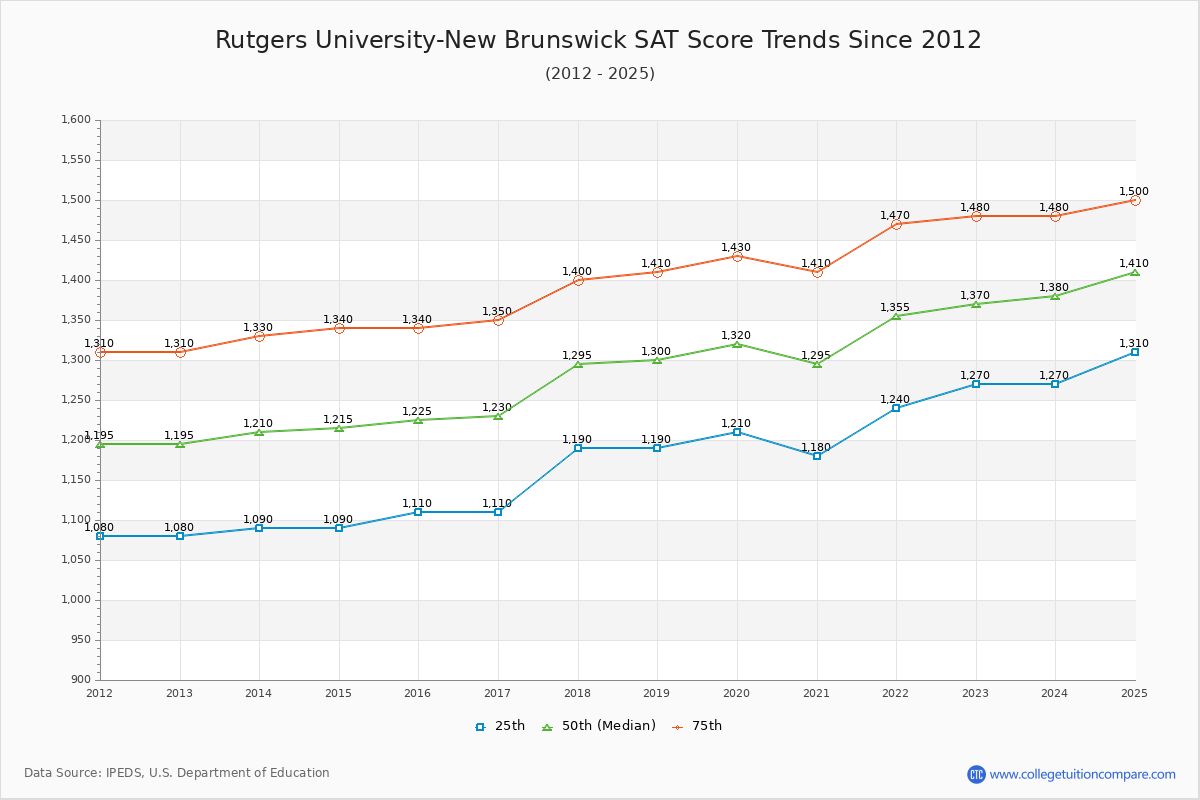
The SAT score have been increased 170 points since 2013. The SAT score has risen almost every year over the past decade, and have continued to rise especially recent years at Rutgers. Compared to previous year, the SAT score increased by 10 points at Rutgers. Compared to similar schools, the submitted SAT and ACT scores are competitive and high at Rutgers.
You can check and compare colleges with similar SAT scores Rutgers by SAT score range 1280-1380, 1330-1430, and 1380-1480.
The 2024 SAT score is 1380 at Rutgers. Over the past 12 years, the average SAT score is 1177 (25 th percentile) and 1404 (75 th percentile). Compared to similar schools, the submitted SAT scores are competitive and high at Rutgers.
The following table and chart illustrate the changes in SAT scores at Rutgers University-New Brunswick since 2013.
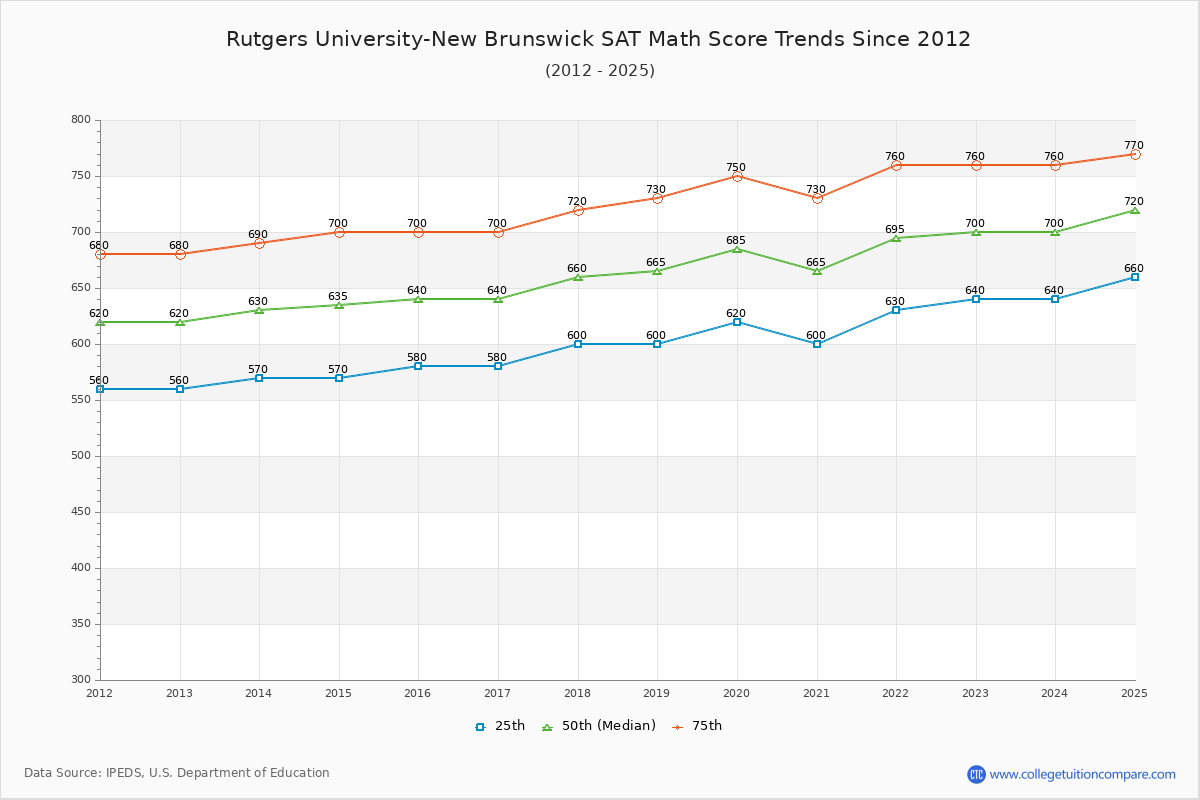
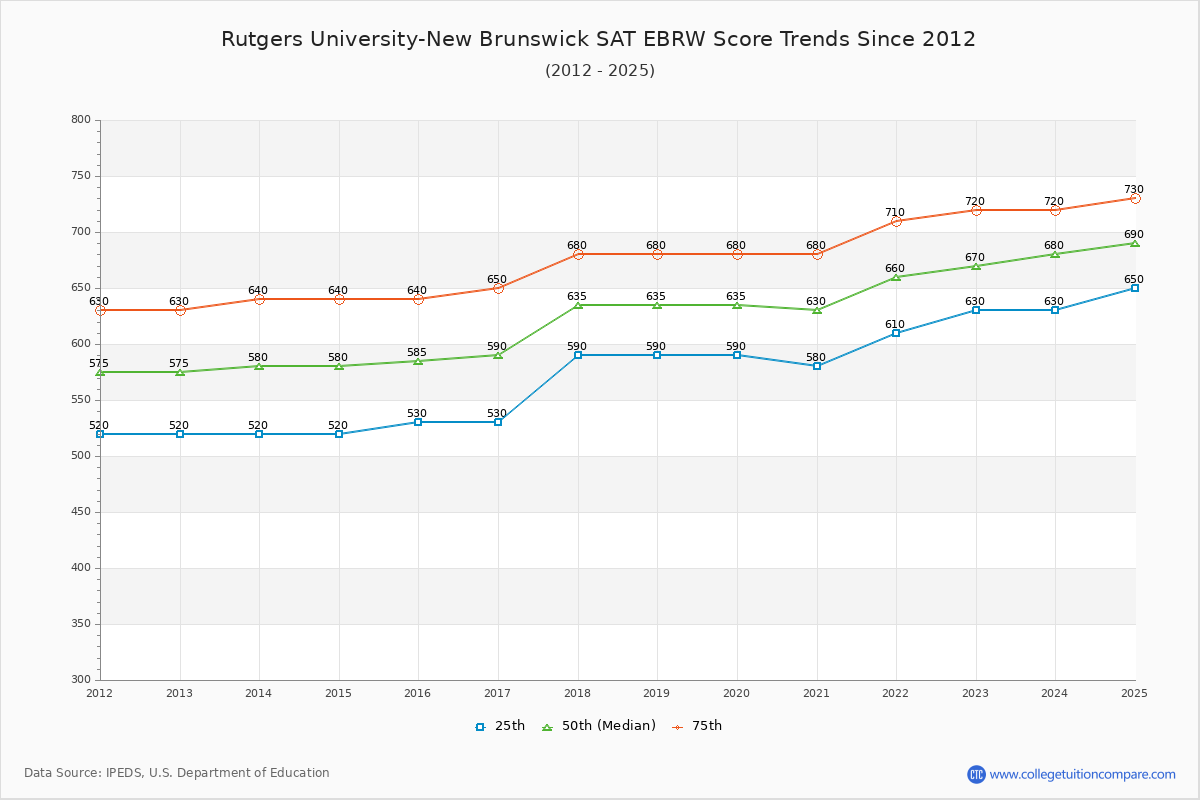
| Year | Total | Math | Evidence-Based Reading and Writing | ||||||
|---|---|---|---|---|---|---|---|---|---|
| 25 th | 50 th | 75 th | 25 th | 50 th | 75 th | 25 th | 50 th | 75 th | |
| 2013-14 | 1,090 | 1,210 | 1,330 | 570 | 630 | 690 | 520 | 580 | 640 |
| 2014-15 | 1,090 | 1,215 | 1,340 | 570 | 635 | 700 | 520 | 580 | 640 |
| 2015-16 | 1,110 | 1,225 | 1,340 | 580 | 640 | 700 | 530 | 585 | 640 |
| 2016-17 | 1,110 | 1,230 | 1,350 | 580 | 640 | 700 | 530 | 590 | 650 |
| 2017-18 | 1,190 | 1,295 | 1,400 | 600 | 660 | 720 | 590 | 635 | 680 |
| 2018-19 | 1,190 | 1,300 | 1,410 | 600 | 665 | 730 | 590 | 635 | 680 |
| 2019-20 | 1,210 | 1,320 | 1,430 | 620 | 685 | 750 | 590 | 635 | 680 |
| 2020-21 | 1,180 | 1,295 | 1,410 | 600 | 665 | 730 | 580 | 630 | 680 |
| 2021-22 | 1,240 | 1,355 | 1,470 | 630 | 695 | 760 | 610 | 660 | 710 |
| 2022-23 | 1,270 | 1,370 | 1,480 | 640 | 700 | 760 | 630 | 670 | 720 |
| 2023-24 | 1,270 | 1,380 | 1,480 | 640 | 700 | 760 | 630 | 680 | 720 |
| Average | 1177 | 1290 | 1404 | 603 | 665 | 727 | 575 | 625 | 676 |
Score Trends Chart" />
 Score Trends Chart" />
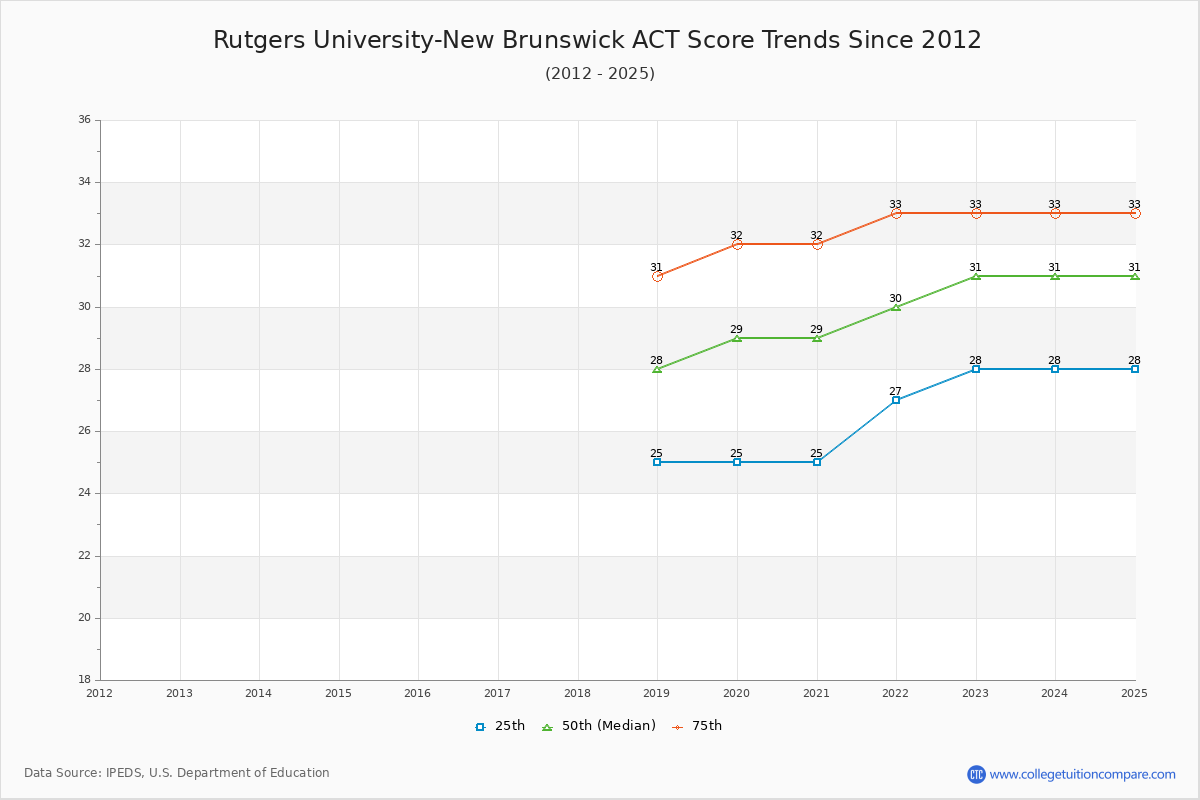
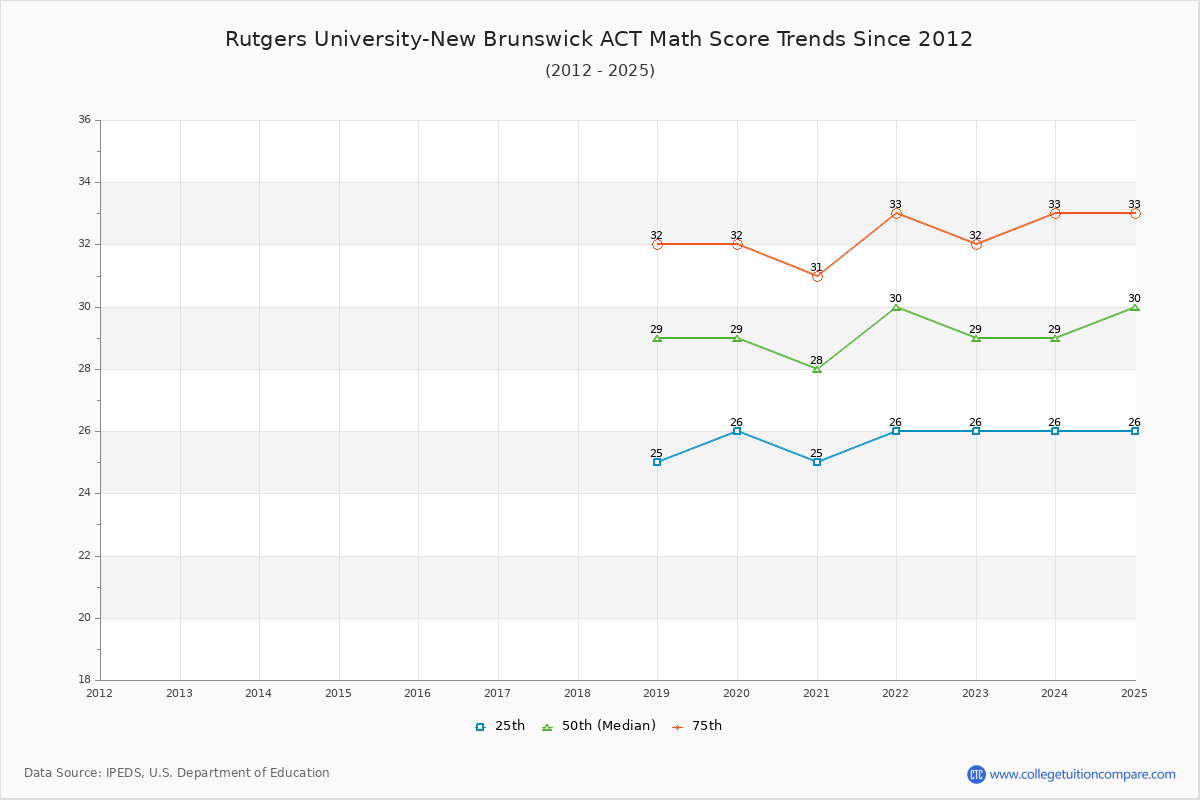
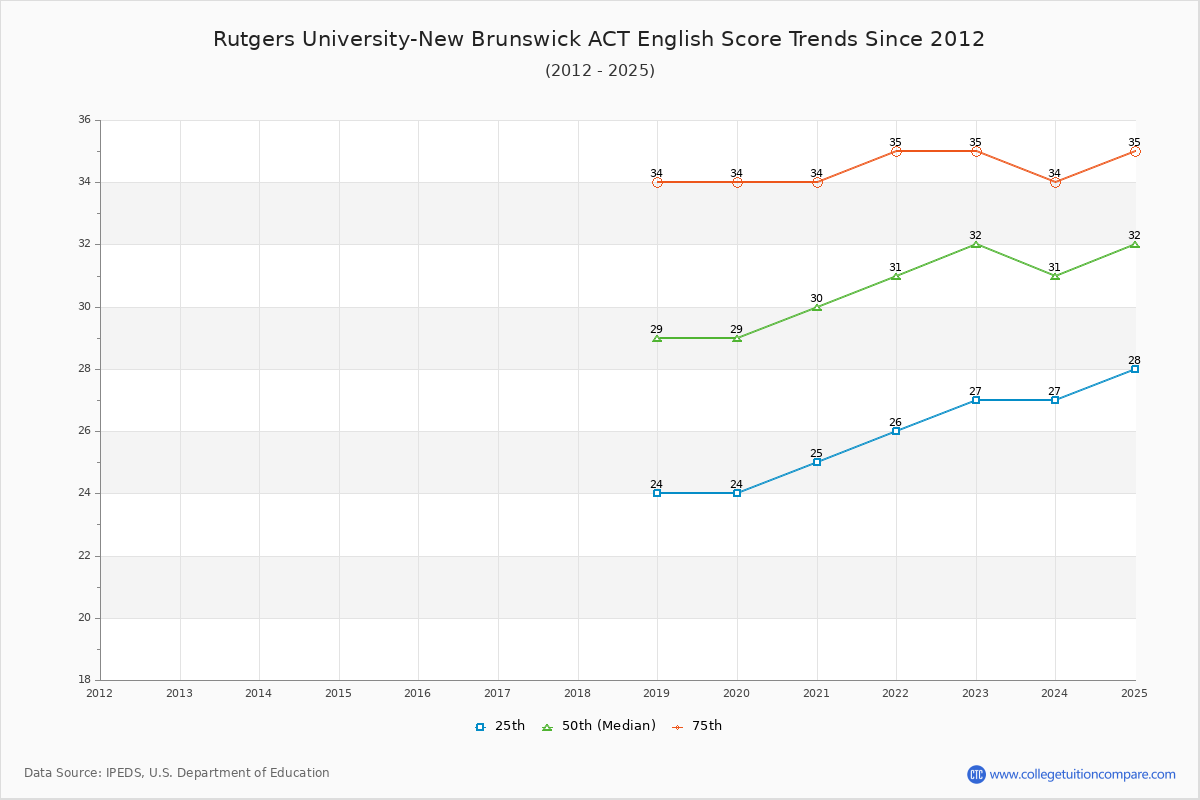
The 2024 ACT score is 31 at Rutgers. Over the past 12 years, the average ACT score of the last 12 years is 26 (25 th percentile) and 32 (75 th percentile). Compared to similar schools, the submitted ACT scores are competitive and high at Rutgers.
The following table and chart show the changes in ACT scores at Rutgers University-New Brunswick since 2013.
| Year | Composite | English | Math | ||||||
|---|---|---|---|---|---|---|---|---|---|
| 25 th | 50 th | 75 th | 25 th | 50 th | 75 th | 25 th | 50 th | 75 th | |
| 2018-19 | 25 | 28 | 31 | 24 | 29 | 34 | 25 | 29 | 32 |
| 2019-20 | 25 | 29 | 32 | 24 | 29 | 34 | 26 | 29 | 32 |
| 2020-21 | 25 | 29 | 32 | 25 | 30 | 34 | 25 | 28 | 31 |
| 2021-22 | 27 | 30 | 33 | 26 | 31 | 35 | 26 | 30 | 33 |
| 2022-23 | 28 | 31 | 33 | 27 | 32 | 35 | 26 | 29 | 32 |
| 2023-24 | 28 | 31 | 33 | 27 | 31 | 34 | 26 | 29 | 33 |
| Average | 26 | 30 | 32 | 26 | 30 | 34 | 26 | 29 | 32 |
 Score Trends Chart" />
 Score Trends Chart" />
The following table compares SAT score changes from last year between Rutgers University-New Brunswick and similar schools.
| 2024 | 2023 | Change % | |
|---|---|---|---|
| Rutgers University-New Brunswick | 1370 | 1355 | 1.11% |
| Northwestern University | 1530 | 1520 | 0.66% |
| Temple University | - | - | - |
| University of Iowa | 1230 | 1240 | -0.81% |
| University of Illinois Urbana-Champaign | 1440 | 1415 | 1.77% |
| University of Michigan-Ann Arbor | 1470 | - | - |
Share your experiences and thoughts about Rutgers University-New Brunswick. It will be a great help to applicants and prospective students!